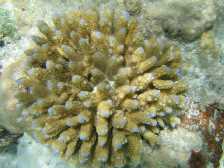
Acropora Branching
(ACB)
Encrusting (ACE)
Submasive (ACS)
Digitate (ACD)
Tabulate (ACT)
Non-Acropora Coral Branching (CB)
Coral Encrusting (CE)
Coral Foliose (CF)
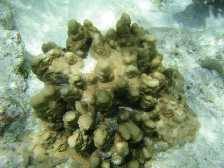
Coral Massive (CM)
Coral Submassive (CS)
Mushroom Corals (CMR)
Blue Corals Heliopora (CHL)
Fire Corals Millepora (CME)
Organ Pipe Corals Tubipora musica (CTU) |
4.15
0.34
0.34
0.23
1.88
1.93
12.10
0.68
4.09
1.88
0.00
0.17
0.34
0.00 |
5.50
0.19
1.19
1.50
1.00
2.06
7.50
0.19
2.13
2.69
0.00
0.06
0.63
0.00 |
2.63
0.25
0.25
0.75
1.75
1.00
10.57
2.42
2.38
3.25
0.00
0.00
0.00
0.00 |
9.24
0.07
1.25
1.88
0.28
1.32
3.06
0.63
1.25
12.15
0.00
0.49
1.46
0.00 |